Britain is known for its famous dishes, whether this is bangers and mash or a beautiful Sunday roast. But with eating habits changing, has it become easier for Brits to order-in rather than go through the lengthy process of preparing and then cooking a meal?
We’ve teamed up with DLM Distributions, which helps takeaways get the most out of their direct letterbox marketing strategies and offers a leaflet distribution service, to find out just how popular takeaways are.
The cost of a takeaway
With apps like JustEat and Deliveroo making it easier for people to order online, Brits seem to be taking the more convenient road to meet their hunger needs. According to research, ordering takeaways cost Britons £1,000 per year — around £80 per month on average.
However, this budget escalates when living in the capital, as the monthly cost of takeaways equates to £107 per person. Although they are likely to order the same number of takeaways on a monthly basis, the cost of them may differ since London is notoriously expensive in all areas compared to other regions here in the UK.
We take a look at regional shopping budgets and remove the cost of a takeaway from them to see the end result on food spending:
According to The Money Advice Service, the South East spends the most on their weekly shopping — budgeting around £59.20. This was soon followed by Northern Ireland (£59.00) and London (£57.50).
Regions that spent the least on their shopping was the North East, which on average, budgeted £45.50 each week. This was followed by Yorkshire & the Humber (£47.30) and Wales (£48.60).
When we looked at the London shopping budget, and split the monthly cost of a takeaway to a weekly payment — this equated to £26.75. Removing this from Londoners’ shopping budget would leave them with £30.75 to spend on food fit for their kitchens.
Splitting the average monthly payment for a takeaway and reducing this to a weekly cost would bring it to £20. Once this total has been removed from the North East (the region that spends the least on its weekly shopping), it would leave a total spend of £25.50.
This was a surprising reality, but confirmed our initial thoughts on takeaway spend here in the UK.
The takeaway split
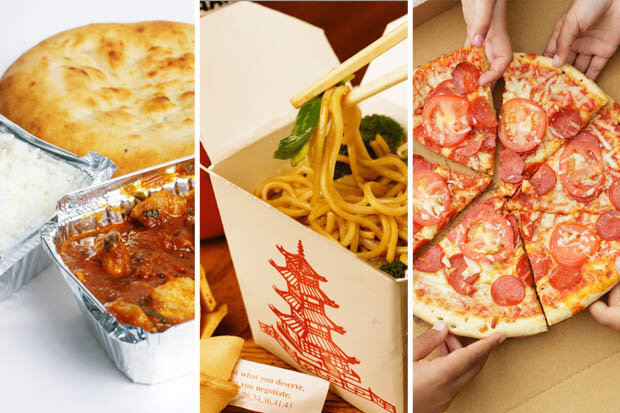
According to Payment Sense, the most popular takeaway cuisine here in the UK with 35% is Chinese. This was soon followed by Indian food at 24%, pizza with 13%, and what we hold close as a staple British meal, fish and chips at 7%.
However, when this translated into where Brits preferred to go in terms of restaurants, Italian food ranked highest with 19%. Indian food followed closely with 16%, then, traditional pub food at 12%. At 10%, English and Chinese food scored low — showing that our tastes for eating out are different to our tastes for eating in.
After looking at gender regarding takeaways in the UK, we found that more men ordered than women. However, in contrast, women spent a larger sum on their takeaways than men.
The takeaway preferred most by men in Britain was Chinese (33%), soon followed by an Indian menu (26%). Pizza (11%), fish and chips (7%) and English (6%) were all strong contenders for most desired takeaways in the UK.
Women also favoured Chinese (37%), as well as Indian (22%) and pizza (14%). Fish and chips was also on their list (6%) — however, unlike the men, English food was not a favourite and was replaced with Thai food (3%).
It seems that the most common method of ordering a takeaway is by telephone with 56% of people doing so. This evidently shows that takeaway menus are still essential for direct marketing — as only 18% of people order through an app (where the menu will be available). The second most popular location was online, at 37% — 30% of people go out of their way to travel to the shop and order in store, highlighting that Brits are taking easier options to ordering food in the UK.


